Project - Charts and Rockets
Once again, we want to take another opportunity to analyze some real data. This time, we’re looking at another data set that’s a bit closer to home.
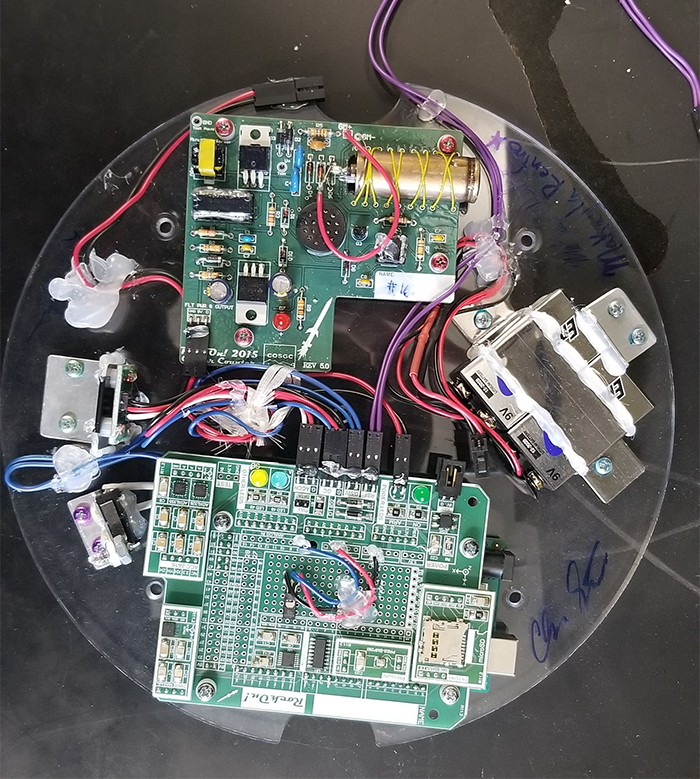
In 2019, we had the opportunity to send a student to RockOn, where they were able to build a satellite that would be flung into a suborbital trajectory in space.
 |  |
The satellite was recovered, as was the data in its payload. And for this assignment, you will be analyzing this data to see if you can learn anything from it.
This time, I want you to download the data file straight to your computer and then upload it to Google Drive for processing. The video above explains how to do this.
When you download this data, pay careful attention to the following:
- The file in a
.csvformat, so you should know what that means and what to do about it. - There is a lot of data in this file, so be aware that it could affect performance on your computer. Be patient!
- All I have done is clean and truncate the data. I have not analyzed it. That’s up to you!
For this assignment, you will:
- Look at each column and see if you can figure out what each one is trying to tell you (You may have to do some googling!).
- Once you think you know what all the data actually represents, try to build a few charts.
- Do the charts look how you think they should?
- Build three or four charts in total and explain what each one represents. Remember, this is a rocket launch, so you should expect to see certain things.
- Do a brief write-up on an empty worksheet of what the data are telling you. What you found out. What you thought was interesting. This data can tell a story. What story does it tell?